It’s no secret that this year has been full of market and economic uncertainty. Inflation, the Fed, geopolitics and more continue to be on most of our radars.
Perhaps the most important way to stay grounded amongst the uncertainty is by being familiar with the facts and figures that drive markets in the long run, rather than the speculation and opinions that occupy headlines for a day or two.
As a result, we see three reasons to remain optimistic.
Corporate Earnings
Corporate Earnings are the link between the economy and markets. Although markets can fluctuate in the short run, rising earnings are what allow stocks to create wealth for investors over full business cycles.
While it is still early in the current earnings season, with about a quarter of S&P 500 companies having reported, overall earnings are exceeding beaten-down expectations. Despite inflation and slower growth, which have directly impacted corporate earnings reports, the numbers remain positive. A commonly used metric is Earnings Per Share (EPS), which is how much money a company makes for each share of its stock. Consensus estimates are that S&P 500 EPS will grow 6.9% over the next twelve months, which is still healthy despite being below the average of 7.9% since the mid 1980s.
Not only do growing earnings continue to support market valuations, which are the most attractive in years, they are a reason to stick to appropriate asset class allocations in portfolios. Since not all sectors can be expected to perform well at all times, staying diversified remains important.
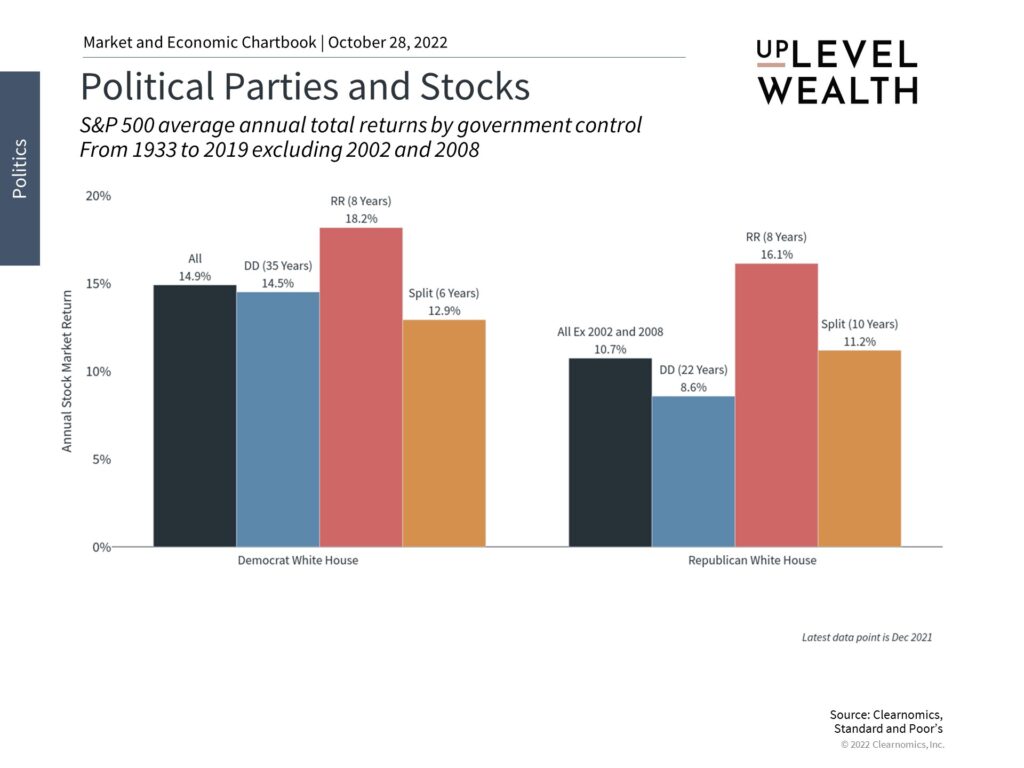
Markets Have Done Well Across Political Parties
With upcoming midterm elections on November 8th, it seems natural to assume that politics could impact stock market returns. After all, elections do affect economic policies which directly impact specific industries and companies. However, how this impacts broader financial markets is often not as straightforward.
History shows that markets have done well in a variety of political configurations under both Democrats and Republicans and, conversely, that poor market conditions often have little to do with politics.
The chart below shows that although there are variations between party configurations, they are all quite positive. It is not the case that one party’s leadership always results in poor economic growth or market returns, and vice versa.
Past performance is no guarantee of future results. Investing risks include loss of principal and fluctuating value. It is not possible to invest directly in an index. Performance does not reflect the expenses associated with management of an actual portfolio.
The full economic cycle is what matters for investment returns, and this often has less to do with who’s in office than other factors that drive growth. For instance, in the 1990s, it’s unlikely that the Clinton administration and the Republican controlled Congress at the time were the main drivers of the tech boom of that era. Similarly, it’s hard to argue that the George W. Bush White House or the split Congress at that time were the reasons for the subsequent bear market of the early 2000’s or the later housing crisis. These were driven by technological and economic trends that were larger than politics.
Perhaps most importantly, economic policies are difficult to evaluate and often work with a lag. There are always pundits – on both sides of the aisle – predicting doom and gloom based on the other party’s proposals. While there are policies that can promote long-run investment spending and labor force growth, the record shows that it’s incredibly difficult to predict the economic impact of any particular proposal.
For instance, while historical corporate tax cuts may have resulted in short-term jumps in the stock market, the true economic benefits occurred over years and decades across political cycles – and far beyond the attention span of short-term traders and media coverage.
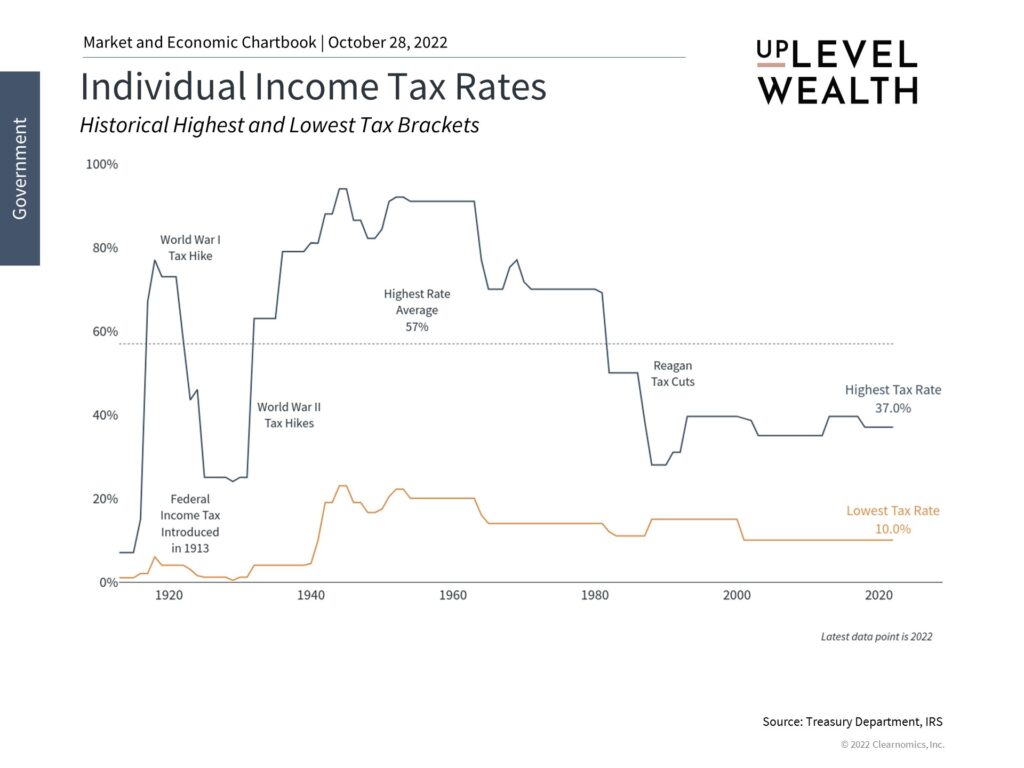
IRS Updates for 2023 May Help Many Households
While marginal tax rates still remain at historic lows, the recently announced IRS adjustments to income tax brackets and the standard deduction could also help many of us. Each year, the IRS makes adjustments to match the average year-over-year increase in what is known as the “Chained Consumer Price Index,” so that taxpayers don’t “creep” into higher tax brackets due to inflation. The IRS has announced 7% increases to these ranges and deductions for the 2023 tax year. As a result, many workers could see higher take-home pay starting January as payroll deductions decrease. These excess savings will be a welcome change even if they don’t fully offset higher prices.
In addition to income tax brackets and the standard deduction, the IRS also made inflation adjustments to many employee benefits, including 401(k) contribution limits.
For employees who participate in 401(k), 403(b) and most 457 plans the limit for 2023 is increasing to $22,500. Employees 50 and older are eligible for a $7,500 catch up contribution, bringing the total contribution amount to $30,000. IRA contribution limits didn’t see as much of a lift, with a $500 bump from 2022 to a total of $6,500. IRA catch-up contributions for those 50 and older remains unchanged at an additional $1,000.
For those who can swing it, maxing out these contributions can help you save more in taxes.
We’re Here to Help
If you have questions about how the IRS updates may impact you, or are ready to put a plan for your future in place, reach out… we’re here to help.
Uplevel Wealth is a fee-only, fiduciary wealth management firm serving clients in Portland, OR and virtually throughout the U.S.